The Outlier Part 2: Patrick Mahomes continues to break charts
I've gathered a collection of the best charts the Chiefs' QB has ruined as he dominates the NFL in a hilariously visual way.
This article is unlocked for all to read/share, because everyone needs to know what Mahomes is doing. If you enjoy going beyond the box score, you can subscribe for $12 a year by clicking the link below and have access to the full archive, as well as mailbags and giveaways. Do it. You know you want to.
“Patrick Mahomes is breaking statistical analysis.”
I wrote those words almost two full years ago, when I wrote about how Mahomes has managed to dominate the league statistically in a way that causes him to break almost every single chart he’s a part of.
Since that time, one would expect that Mahomes’ statistical absurdity would cease, or at least slow down. After all, the NFL is designed to humble everyone and create parity. Multiple very talented quarterbacks have exploded onto the scene who should narrow the gap between Mahomes and the field. Defenses are gunning for the best way to slow down the Chiefs. He lost Tyreek Hill in a trade prior to the 2022 season.
All of these things should have led to a return to relative normalcy for Mahomes. But it hasn’t. Not even close. It seems like every other week or so a new chart shows up with Mahomes being placed so far above the field (and other elite quarterbacks) that he basically breaks the scale. We whistle in amazement and retweet/restack, and then move on.
Today, I’m going to do my best to put all the best of those charts in one place, and explain briefly what each of them mean in practice. The end point is that Patrick Mahomes remains, in a league full of terrific quarterbacks, an outlier. His distance from the field in meaningful measures of quarterback play should not ever be taken for granted, especially doing so over the course of 5 full years. In short; We’ve never seen anyone like this. And that’s what makes him The Outlier.
Let’s get started.
(NOTE- “EPA” is “Expected Points Added,” basically a way of measuring how well the ball was moved in a way that made it more likely to score)
(SECOND NOTE- Shout out to Sumer Sports and Tej Seth for a lot of these numbers, as well as Ben Baldwin and everyone else who has worked so hard to get more advanced numbers publicly available)
Moving the ball in non-garbage time
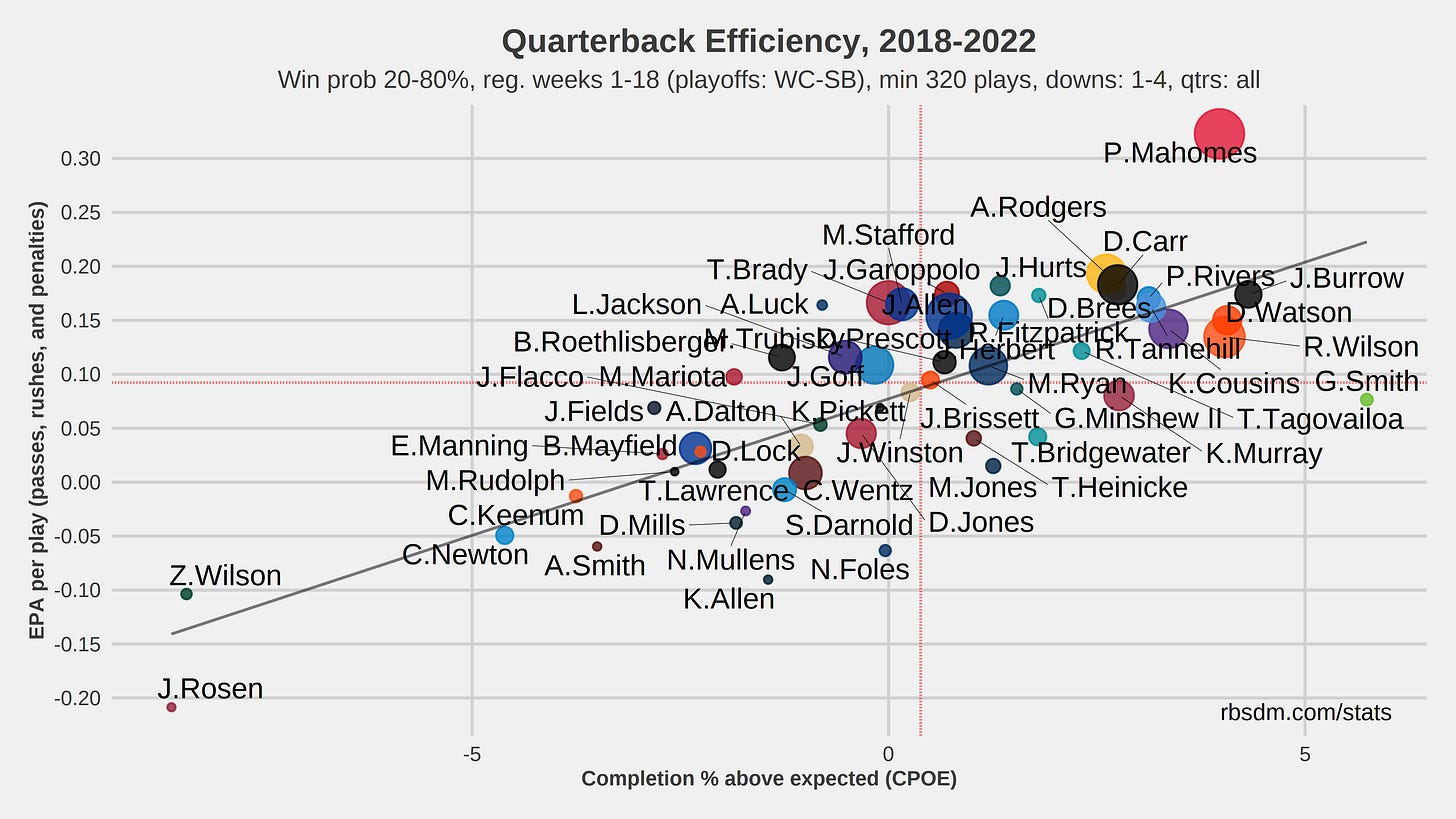
This is one of the most “basic” charts we’ll have here, just to get us started. What this chart does is take all quarterbacks who have seen significant snaps over the last 5 years and looks at their EPA per play (how well they’ve moved the ball in a way that makes it more likely that the team scores) as well as completion percentage above expected.
The trick with this chart? It throws away garbage time by only including snaps where the game has a win probability of 20-80 percent (meaning one team isn’t nearly certain to win). In other words; What quarterback does the best work when it’s a “normal” situation and not garbage time?
The answer? Mahomes, by a country mile. There’s more separation between Mahomes' EPA per play and the closest QB (Rodgers) than there is between Rodgers and… well, basically a couple dozen quarterbacks. There’s him, then a gap, then everyone else.
Let’s start getting more situational.
Early downs vs late downs
This chart splits EPA per play on early downs (1st and 2nd) vs late downs (3rd and 4th). You’ll note that some quarterbacks are excellent on early downs but are below average on late downs. One thing to know is that on early downs, scheme and a strong run game can hide you a bit more (see Tannehill, Ryan, who does a terrific job executing the offense but falters on later downs a bit). On later downs, it’s a more obvious passing situation and tougher to perform.
In case you missed it, Mahomes is WAY in the top right. He’s not just the best on early downs, he’s so much better on late downs that he basically breaks the scale. No one else even reaches 0.2 EPA/play. He’s above 0.4. That’s twice as high for non-math-majors like myself.
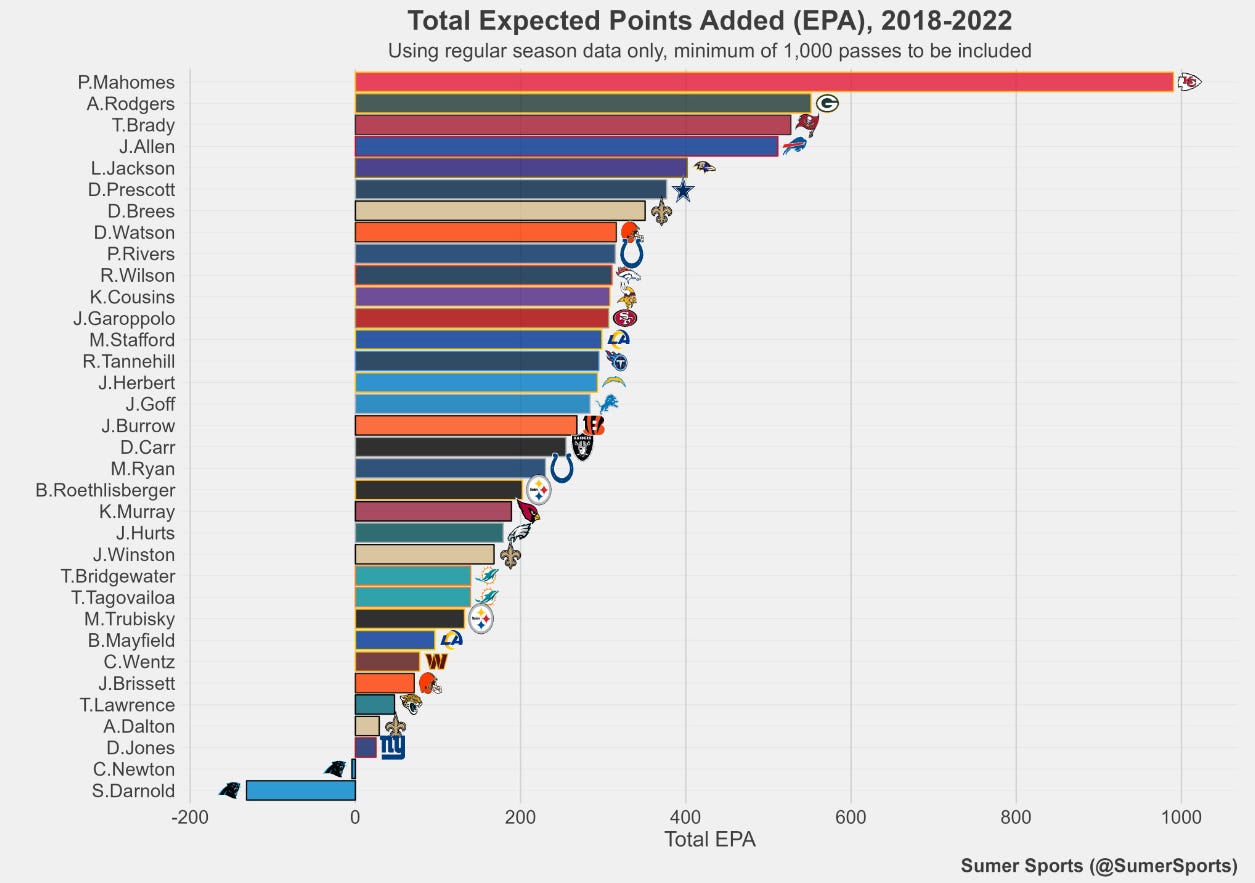
Total expected points added
This is measuring “total EPA,” which is basically the same thing (expected points added) but just looking at the total amount. By doing so, you can see just how many more “expected points” (by moving the ball effectively) Mahomes has added than anyone else over the last 5 years.
Good vs bad defenses
This chart is terrific, because it focuses on what QB’s do against top-half defenses (the vertical chart) vs what they do against bottom-half defenses. In other words, are you feasting against bad defenses while struggling (or being average at best) against good defenses (cough cough Phil Rivers and Jimmy Garoppolo cough)?
Mahomes, interestingly enough, isn’t the very best against bad defenses (a measly 3rd). But look what happens when he faces good defenses. His performance barely drops against top-tier opponents, while every other QB sees a significantly more sizeable decrease in efficiency.
In other words, facing great defenses barely slows Mahomes down, and he’s unique in that way.
With a lead vs trailing
This chart separates situations into tied/leading vs trailing. When his team is tied or leading, Mahomes trails only Brees over the last 5 years in EPA per play. But look what happens when the Chiefs are trailing. His EPA per play goes up and becomes even better than it is when leading or tied.
In other words, Mahomes is BETTER when trailing, when passing is harder as teams know you have to throw to catch up.
Win probability efficiency
This chart shows something similar, only utilizing win probability rather than the score itself. Note how Mahomes is the best when his team is expected to win… but again EVEN BETTER when his team is expected to lose. It’s worth noting this is “per dropback” rather than “per play” so it’s not as though he’s being carried by the run game, etc.
When his team is trailing, no one is close to Mahomes in terms of efficiency.
If you’ve read this far and aren’t a subscriber, what are you waiting for? Hit that button and let’s talk some Chiefs.
Win probability in the playoffs
What about in the playoffs? This chart is built a little differently but measures a similar concept as the one above, just utilizing “win probability added” (which is still a measurement of how well the QB moves the ball) and accounting for how likely the team is to win.
Look at Mahomes’ line. Notice how it’s far above everyone else’s when you’re from zero percent to 50% of win probability pre-play (the horizontal axis)? What that means is that when his team is trailing in the playoffs, Mahomes adds way, way more win probability (ie moves the ball better) than any of the other QB’s on this list. And those QB’s are Brady, Manning, Rodgers, and Brees.
In other words, in the playoffs, it’s a demonstrable fact that Mahomes has been much, much, much better when trailing (and better overall) than any of the QB’s in the last 30 years that someone might argue is the GOAT. Including the GOAT.
Speaking of being more clutch than anyone, ever.
Game-winning scenarios
Is the game on the line? Then your best bet is Mahomes… then a massive, massive, massive gap. In situations where we’re looking at a “game-winning drive” (from a tie score to losing by 8 with 4 minutes or less in the game), Mahomes’ EPA per play is over 0.5, an absurd number that laps even his record-breaking “normal.”
Name whatever QB you want, and he’s literally not half as good as Mahomes in those situations.
Man vs zone
This is only for 2022, but it’s hilarious. Do you want to play man coverage or zone coverage against the Chiefs? The short answer is it doesn’t really matter, because Mahomes shreds both better than anyone else.
Maybe blitz him?
LOLOLOLOLOL
Don’t blitz Mahomes.
Throwing deep vs throwing shallow
Some quarterbacks make their living throwing short/intermediate (Jimmy G). Some have elite deep weapons (Tua) and live with the deep ball.
Mahomes? Doesn’t matter. He’s elite in production in both areas.
We’re running out of space, so one more…
Likelihood of a multiple-touchdown game
Tej is a good guy who is doing terrific work, and this is one of my favorites. This graph shows how likely it is that Mahomes will throw “x” number of touchdowns in a given game compared to the NFL average. Note that the “average” is that there is slightly above a 50% chance of 0-1 touchdowns in a given game, and barely a 10% chance that a QB throws at least 3 TD’s in a game.
With Mahomes, you are more than twice as likely to get a 3 or 4 touchdown game than a normal quarterback. You’ve got a higher likelihood that Mahomes throws 4 touchdowns than 0 touchdowns. Re-read that last sentence.
There’s never been anything like Mahomes, a genuine outlier in a sport designed for parity. And it’s worth taking the time to really appreciate just what a unique, historical thing we’re seeing happen every time he takes the field.


It's hard not to just smile while reading this. Aside from one year of Montana, Trent Green and part of Alex's career the Chiefs QB was more often than not a liability that needed to be overcome by other parts of the team (defense, RB, OL). Now we have that GOAT playing the position and it's amazing to see how many issues he can cover up. ST mistake after mistake - he can overcome. Defensive issues, he will nullify those. If Veach's draft this year is even a fraction as good as it was last year then Mahomes will benefit from the rest of the team rather than be forced to carry the team on his shoulders. That'll be a wonderful thing to see.
What I love about that first graph is that it demonstrates something incredible: Mahomes is, to "great" quarterbacks, what "great" quarterbacks are to average ones. His margin of victory is that large. It is not a close competition. He is ~50% better than they are when the snaps are meaningful.
It's hard to explain that to people who don't watch every single snap from Mahomes on a weekly basis (or do meaningful statistical analysis, instead of just using old stats to fit their preconceived narratives). Mahomes is as close to a "sure thing" as there's ever been in NFL history. Typically, a player regresses to the mean after an all-time great season. That's why the "Madden curse" exists. Mahomes broke the Madden curse. Twice.
If I wrote a book about Mahomes' career before it happened, people who read my speculative fiction would have said, "you clearly don't understand the NFL. This is totally unrealistic. Every time there's a big spot he comes up with a big play! It doesn't work that way! Sometimes the defense wins! You only have like 5 games in his entire career when the defense won, and two of them he was injured, and a third was a 54-51 shootout on MNF! That never happens!"
Mahomes is absurd to such a degree that it's taken 5 years for even professional NFL experts to wrap their heads around it, and just acknowledge the obvious: the greatest football player ever to play the game is a Kansas City Chief. And we're not even sure if he's reached his prime yet!