The Outlier: Patrick Mahomes keeps breaking charts
The Chiefs' quarterback is uniquely great in a way that makes him constantly an anomaly, and it's hilarious
Patrick Mahomes is breaking statistical analysis.
I’ve written many times about what makes Mahomes a great quarterback. There are a lot of things that add to it, from his ability to operate perfectly within structure or against the blitz, to the way he plays mind games with defenders, to how his insane competitiveness gives him an edge, and a lot more than I can justify adding to a single paragraph.
That said, today I’m not here to celebrate Mahomes the player. I’m here to celebrate Mahomes the outlier. Because not only is Mahomes breaking NFL defenses, he’s breaking statistical charting of quarterbacks.
What do I mean by that? Well, here’s a recent example.
(NOTE: You’ll want to know that “EPA” means “Expected Points Added,” basically a way of measuring how good a QB/offense is at moving the ball with consistency and making it more likely they score. “CPOE” means “Completion Percentage Over Expected,” which measures a QB’s completion percentage compared to how likely they are to complete a pass. It’s an imperfect measurement that punishes more aggressive QB’s, but still one worth looking at. Anyways…)
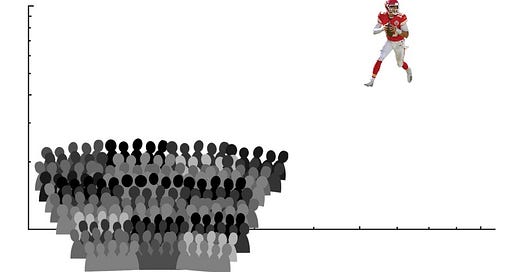
Can you find Mahomes on that chart? I can’t blame you if you cannot. After all, he’s all by himself on the waaaaaaaay far right at the top. For what it’s worth, “up” and “to the right” in these charts are almost always a good thing.
This chart gauges how well quarterbacks have played in Week 1 throughout their careers. As you can see, there’s Mahomes and then the rest of the league. There’s no doubt that Andy Reid gives him a decided edge here, but it’s worth noting that former Chiefs’ quarterback Alex Smith is much closer to the middle of the pack. Mahomes is alone.
And this is a constant with him. There are multiple times charts looking at how quarterbacks perform have been divided into “Mahomes” and “everyone else.” Today, we’re going to celebrate those charts, because the season is almost upon us and life is good.
Let’s start with how he performs in “pure passing” situations.


A passing situation is measured by how likely a team is historically to pass in a situation. As you might imagine, a 70% or greater situation would be 3rd and long, or when trailing, etc. It’s when it is hardest to pass the ball, as opposing defenses know that’s what you’re doing and are pinning their ears back to rush the quarterback.
Mahomes is, by EPA per dropback (which includes scrambling, a trait he’s criminally underrated), literally twice as good as anyone else. Please note that some quarterbacks considered to be close to his equal (coughing noise Josh Allen coughing noise) actually have a negative EPA in those situations.
But hey, why stop at just obvious passing downs? Let’s be more specific, like 3rd and long!


This is a situation where Mahomes screws with the scale of the chart by being so far and away better than everyone else.
Do you like what you’re reading? Do you like coverage that goes beyond the box score? You can subscribe and get several hundred in-depth Chiefs breakdowns for 12 bucks a year forever by clicking the link below. That’s 60% off, the price of a footlong sub, forever. The price is locked in so it’ll never go up on you. Smash that link like Mahomes smashes charts.
Note that this chart looks at 2 different things. The first is once again EPA/play, where Mahomes is (yep, again) more than twice as good as his nearest competitor. The other measurement is conversion rate, where Mahomes clocks in at a shade above 36%.
Another way of saying this is that on 3rd and 6+, there’s more that separates Mahomes’ EPA/play from the next closest quarterback than separates Tom Brady and Kirk Cousins. And in terms of conversion rate, he’s farther ahead of Brady than Brady is of Blake Bortles. Brady is the GOAT, and no one denies it. But the facts are what they are in this particular case, and he doesn’t come close to Mahomes on 3rd down.
But hey, maybe it’s different on other 3rd downs, if we stop making it just “third and long?” Yeah, it’s not.
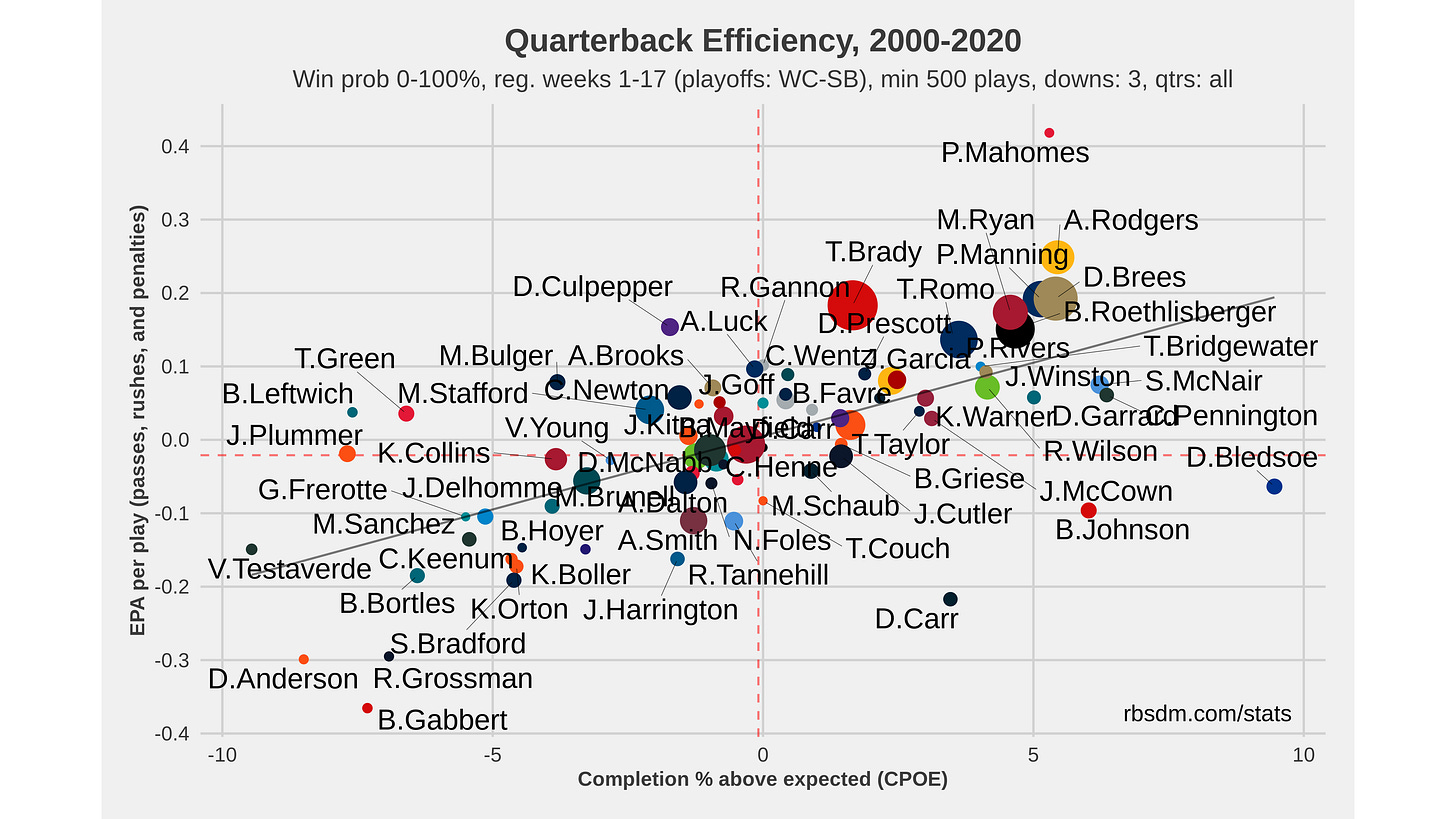
I included this tweet from Ben Baldwin in order to give him credit for his exceptional rbsdm.com site, which helps us track such things. He’s also a great Twitter follow to see things from the statistical side. But obviously, 2018-2019 feels a bit unfair. What if we compare Mahomes on 3rd down to all QB’s since 2000 (with a minimum of 500 snaps)? Would he break that chart too?
Pretty much, yeah. This is where the CPOE gets interesting, as Mahomes’ percentage is lower than some QB’s. However, that can be accounted for the fact that Mahomes always throws for the sticks rather than taking checkdowns, which creates an inherently riskier environment (we’ll get to that later) and will lead to more incomplete passes and messing with CPOE, which doesn’t punish but rather rewards safer, but less-likely-to-earn-the-first-down throws.
Mahomes’ EPA/play is over 0.4, while no other quarterback is even close to 0.3 EPA/play. In fact, the only quarterback that Mahomes doesn’t double (notice how he’s always doubling stuff?) is Aaron Rodgers, the only other QB to be placed above 0.2 EPA/play. And hey, you might say “well it’s just an additional 0.2, how much a difference could that make? Well, when we consider we’re talking about over 500 snaps, you’re discussing an extra hundred “expected points” added by Mahomes compared to everyone else ON THIRD DOWN ALONE.
Re-read that last sentence, because you might have missed it. On 3rd down alone, Mahomes added a full hundred “expected points” to his team compared to other quarterbacks in this chart over the course of 500 snaps. And with every snap, that gap only widens.
But, hey, we’re only halfway done. There are plenty of other charts to break. Like ones that show how Mahomes fares when trailing.


What does this one mean? It means the less likely his team is to win, the better Mahomes plays. And when compared to many quarterbacks who are viewed as some of the best in the game, he stands out alone in that regard.
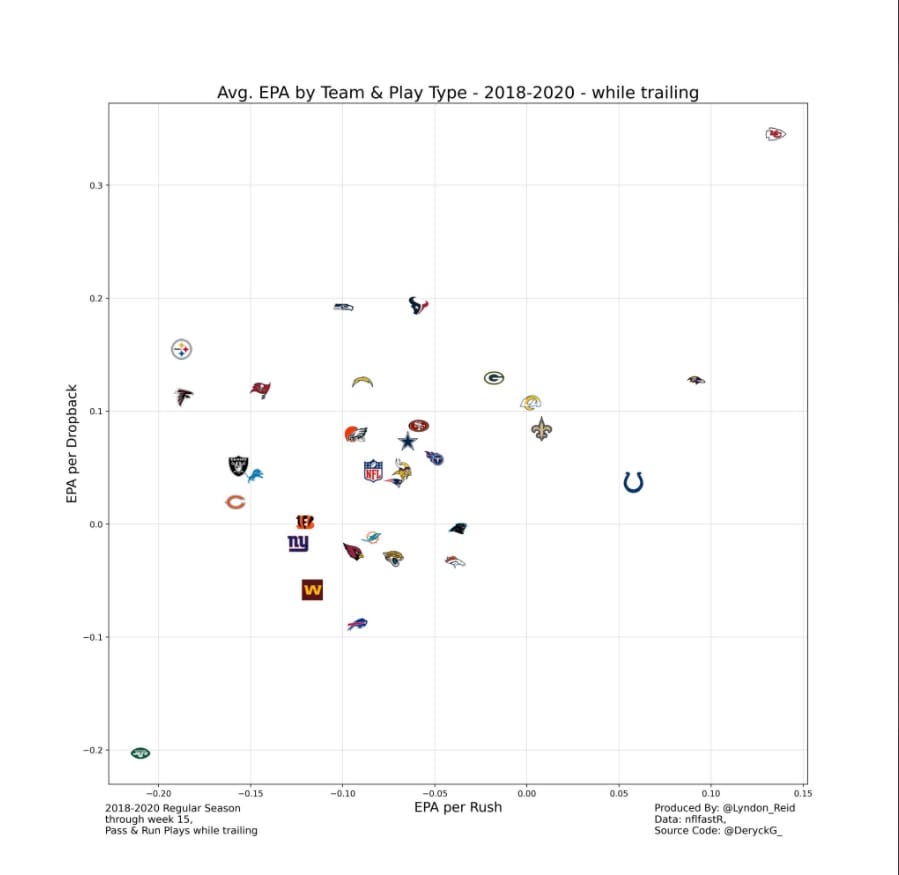
Here’s another way of looking at it, showing how the Chiefs fare in EPA/play when trailing compared to other teams.
Once again, there are the Chiefs, all by themselves. This is becoming almost mundane, but in the best possible way.
Here’s another one, provided via my colleague Ethan Douglas as part of an extensive article as to why Mahomes’ success on 3rd down isn’t a fluke:
What this chart shows is that the rest of the NFL, as the distance needed to gain a first down (on 3rd down) increases, doesn’t keep throwing to the sticks. Other quarterbacks, at around the 8 yard line or so, start throwing short of the first down marker, with that difference between depth of target and yards needed for a first down increasing the more yardage needed to convert.
Not so with Mahomes, who continues to throw past and to the sticks all the way to 3rd and 20.
But hey, enough with all these boring in-depth stats and hard to read charts. Let’s talk touchdowns!

A list counts as a chart, right?
Here’s an older one, but still fantastic.


You should read Scott’s recent article on the top 100 quarterbacks of the 21st century, as it contains a lot of excellent information. However, this tidbit is fascinating despite its age… the basic idea is that Mahomes doesn’t collect garbage time stats or necessarily benefit statistically from wins. Rather, he performs well in both wins and losses, with less deviation than any other quarterback.
One more for the road from Scott:


“ANY/A” is “Adjusted Net Yards per Attempt,” which is a statistic that takes into account not just yards and attempts, but touchdowns, interceptions, and sacks. And here, as basically everywhere else, Mahomes stands on an island by himself against winning teams in terms of how well he performs.
There are charts out there where Mahomes doesn’t stand out in such fantastic, outlandish, obvious ways. And of course, some of these charts need updated data. But as often as not so far in his career, when Mahomes is compared to other quarterbacks in the league the result is the same:
(shoutout to @jessebritches for this hilarious bit of fun)
Patrick Mahomes remains, 4 years into his career, the outlier. And I for one cannot wait to see what he does in year 5. But first, I think I need a nap after reading all of these back to back. Or maybe a cold shower.
Now seriously, subscribe so we can have this much fun all year.


DON'T. TAKE. HIM. FOR. GRANTED.
It's all about....
#PatStatsFever
Barring a catastrophic injury, he will go down in history as the greatest QB ever. I still have to pinch myself every time I acknowledge that he plays for the Chiefs.